
Read a project retrospective
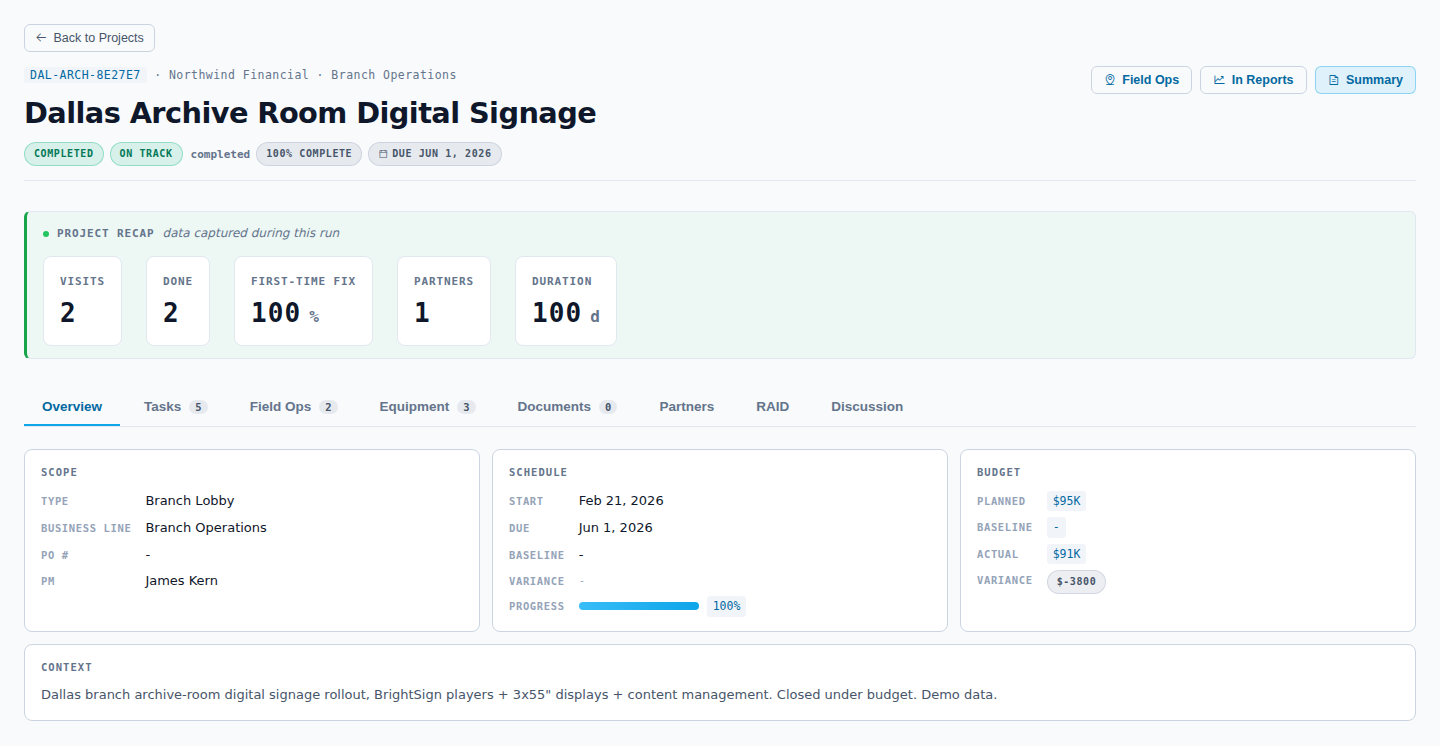
A project just closed and you want to know how it actually went: how many onsite visits it took, how many slipped, whether the work got finished first time. ApexAV builds this recap for you. When a project is marked completed, a green PROJECT RECAP band appears at the top of its detail page, reading the visits attached to the project so you don't have to assemble a post-mortem by hand.
Before you start
- The project has to be marked completed. The recap band only appears once it is.
- You need a seat that can open the project's detail page, which every role can. Field operations and viewers see the projects they are assigned to.
Open the recap
- Open the completed project from the Projects list.
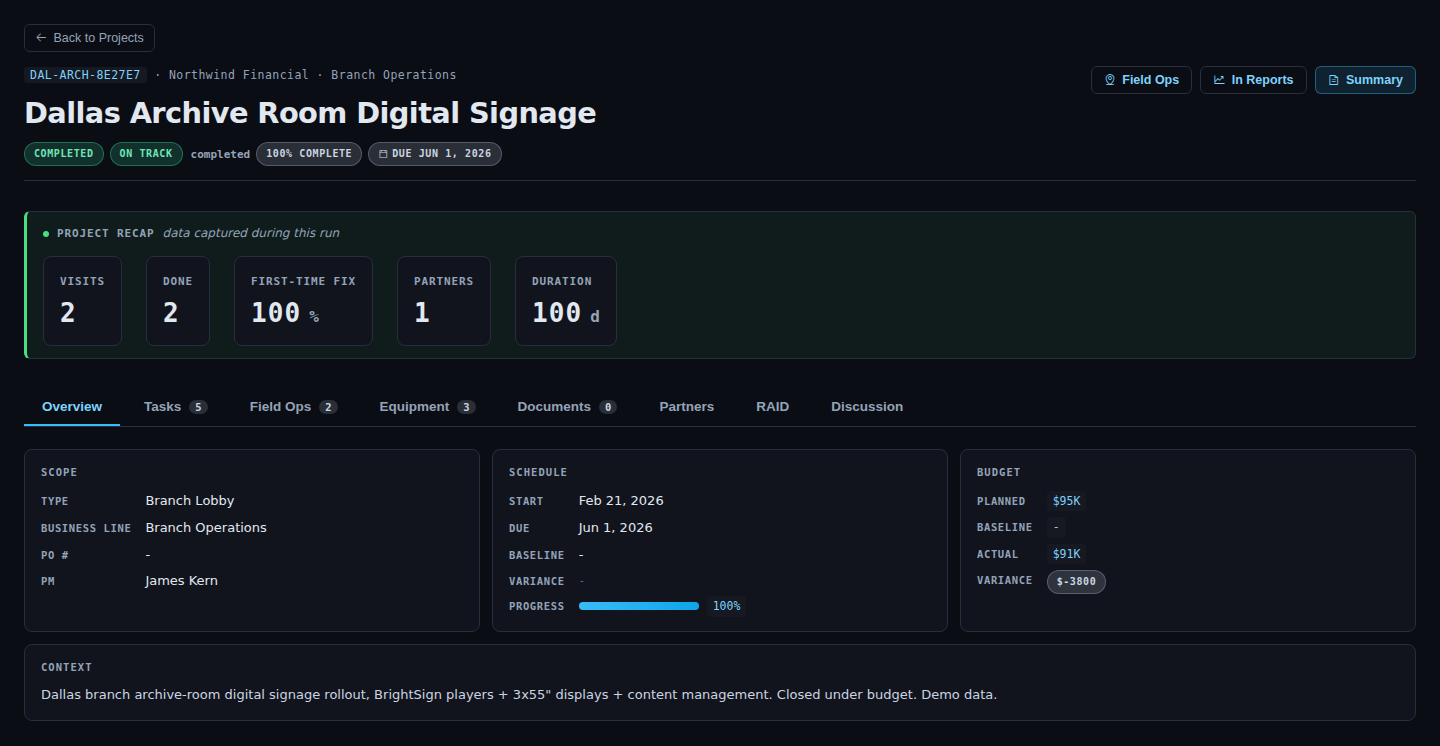
- Look at the top of the detail page for the green PROJECT RECAP band.
What the recap tells you
The band reads the visits attached to the project and summarizes them:
| Metric | What it means |
|---|---|
| Total visits | How many onsite visits the project took |
| Done / partial / blocked | The outcome breakdown of completed visits |
| Reschedules | How many times a visit got pushed |
| First-time-fix % | Share of work finished without a return trip |
| Partner count | How many partners worked the project |
| Duration in days | How long the project ran end to end |
If the project has a discussion thread, the last few messages often include the partner's own retrospective notes, the "what we'd do differently next time." The 5th Avenue Webex rollout demo project includes a model four-point retrospective from the lead integrator if you want to see what a good one reads like.
See the same data across projects
One project's recap answers "how did this one go." When you want the pattern across many projects, the Field Ops Reports tab shows the same underlying data as bar charts: Why visits slip by reschedule reason, Visit outcomes, and the partner performance trend.
Going deeper
The recap isn't a separate document you generate or edit. It's computed live from the visit records on the project, so it always reflects what was actually logged in the field. If a number looks off, the fix is in the visit records, not the recap.
Result
You get the summary a post-mortem would give you, drawn straight from what partners logged during the work, without anyone writing it up.