
Get started with ApexAV
Your company just signed up for ApexAV, and you are the person who runs the operation. This walkthrough gets you from your first sign-in to a clear read on your work: which projects are active, whether your devices are healthy, and what your field team is handling. By the end you will know where each of those lives and how to reach them again.
It takes about ten minutes. Follow it in order. Every step is built to work on a fresh account, so you can trust what you see.
Before you start
You need two things:
- The email address you signed up with.
- Your ApexAV password. If you signed the company up, you set this during signup.
The person who registered the company (probably you) is the Company admin. That account can see everything in this walkthrough.
The path you'll follow
Here is the full route before you take it, so you know where each step leads.
The dashboard is home base. Each later step starts from there.
Step 1: Sign in
- Go to apexavcloud.com and click Sign in.
- Enter your email and password.
- Click Sign in.
ApexAV drops you on your dashboard. This is the screen you will see every time you log in.
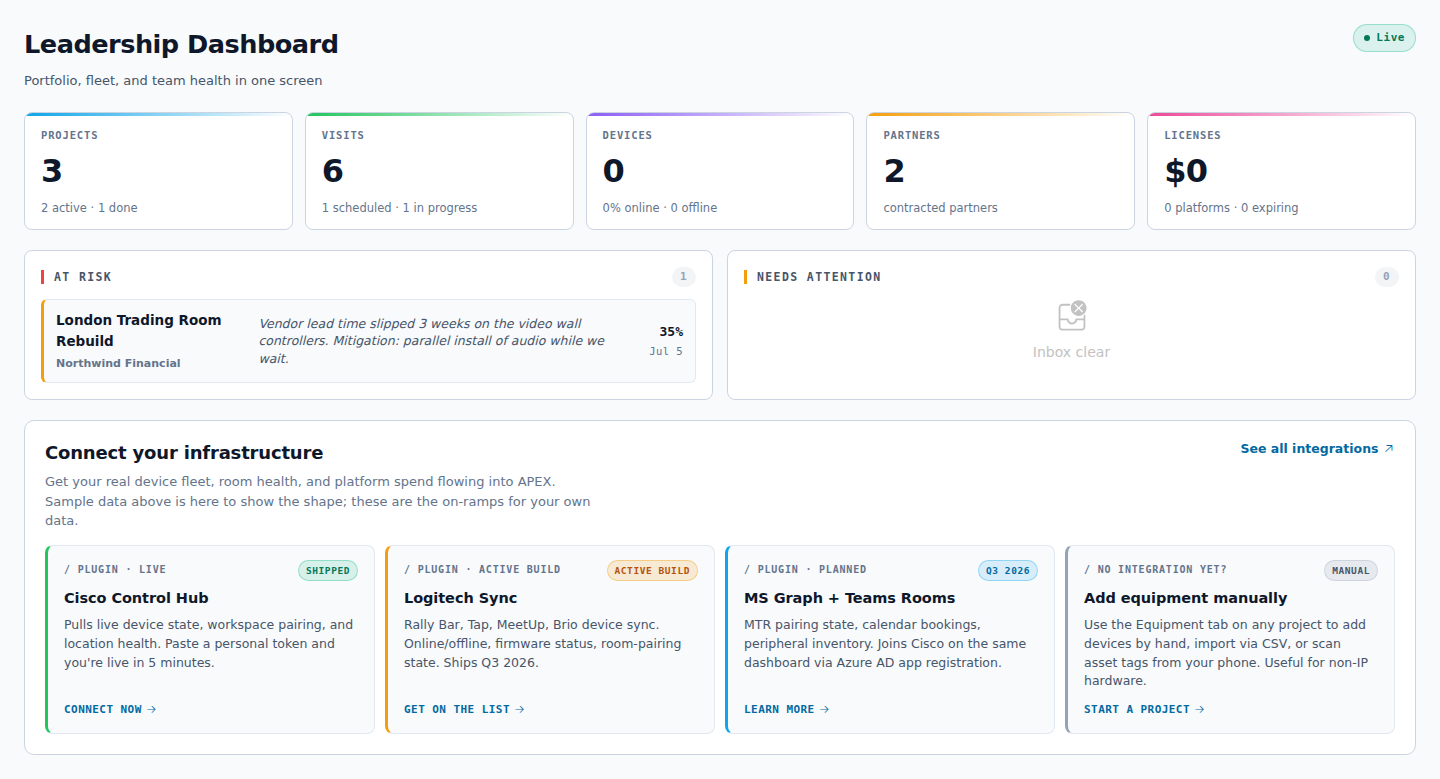
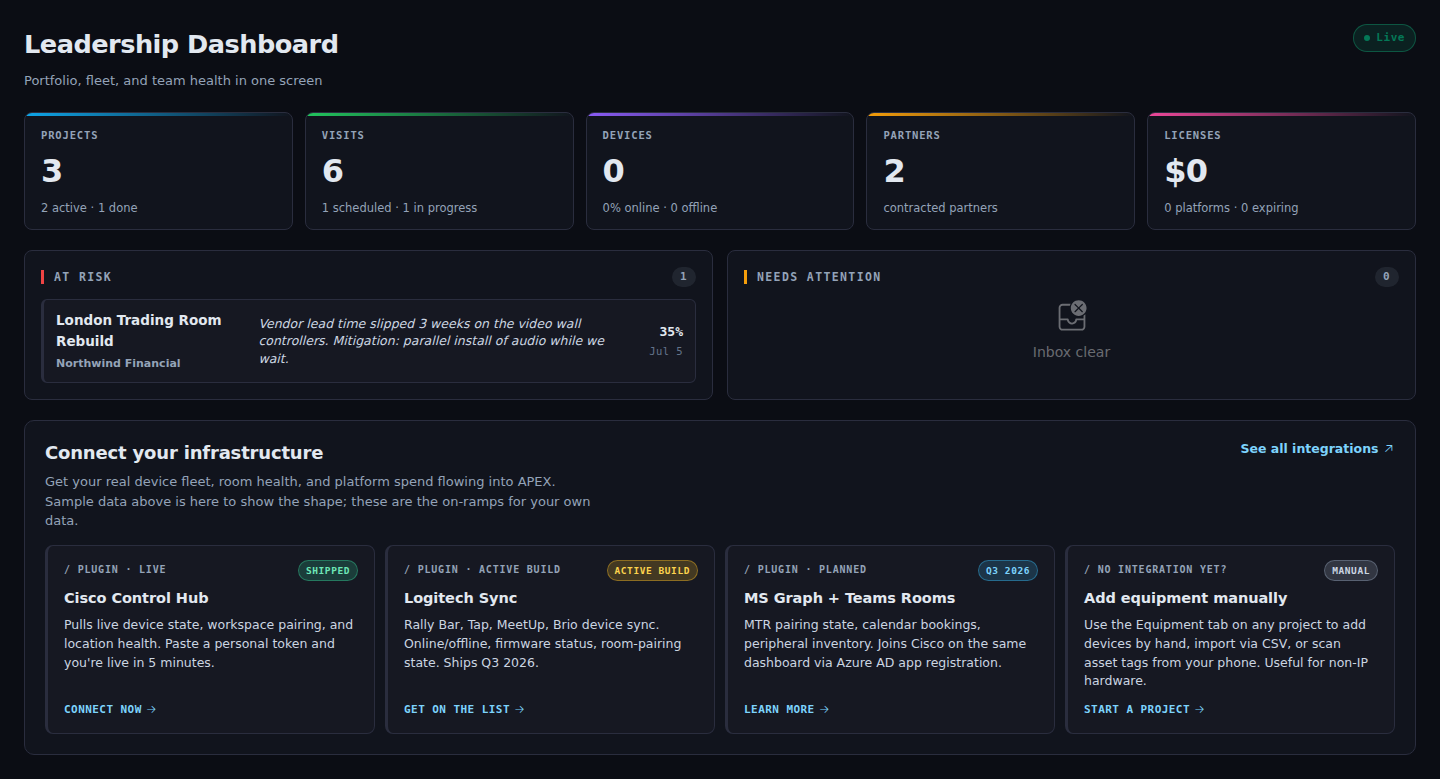
Step 2: Get oriented on the dashboard
The dashboard is your operation at a glance. It summarizes three things:
- Active projects, so you see what is in flight.
- Device health, so you know if any monitored equipment needs attention.
- Field tickets, so you see what your on-site team is working on.
Down the left side is the navigation that takes you into each area in full.
| Left nav item | What it opens |
|---|---|
| Projects | Every project, with status and detail |
| Field Ops | On-site work and the visits behind it |
| Infrastructure | Your monitored equipment, over its lifecycle |
| Rooms | Room readiness for each space you run |
| Licenses | Software licenses and warranties you own |
| Reports | Roll-ups across projects and budget |
TIP
You can always click the ApexAV logo or Dashboard in the left nav to come back to this screen.
Take a few seconds to read the three summaries. Now you will open each one in full.
Step 3: Open your first project
- In the left nav, click Projects.
- You land on the project list. Click any project row to open it.
The project detail view shows you that project's status, its tasks, and the people on it. This is where you go when someone asks "where are we on the lobby refresh?"
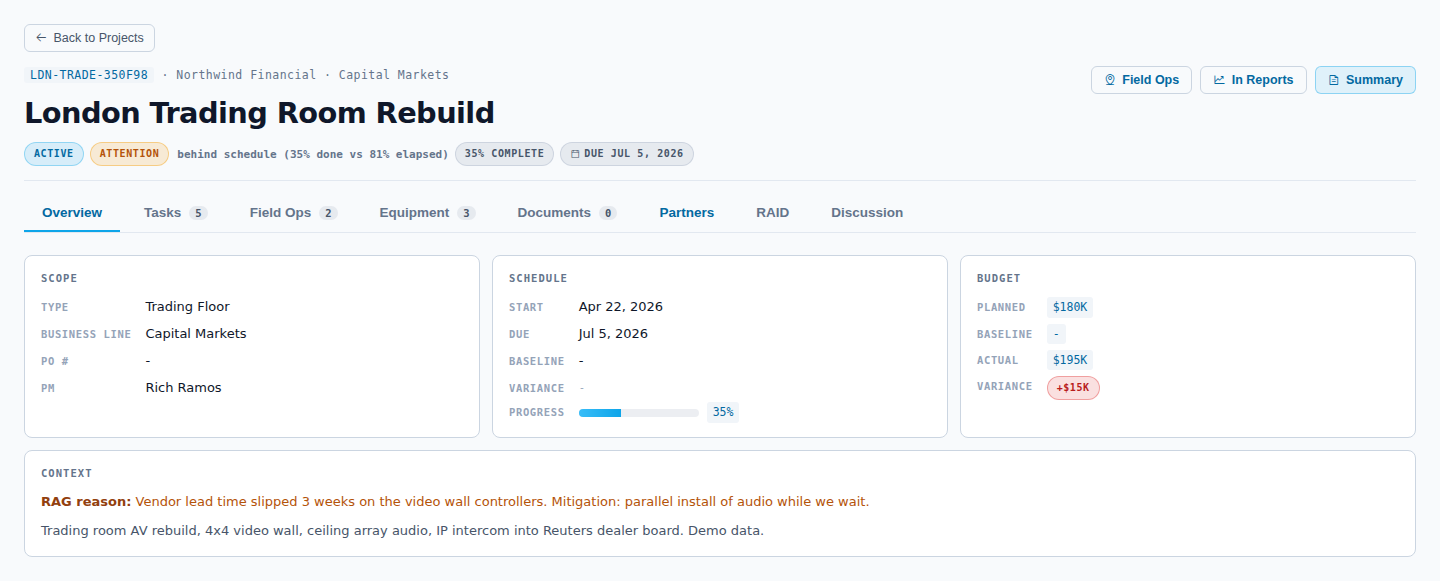
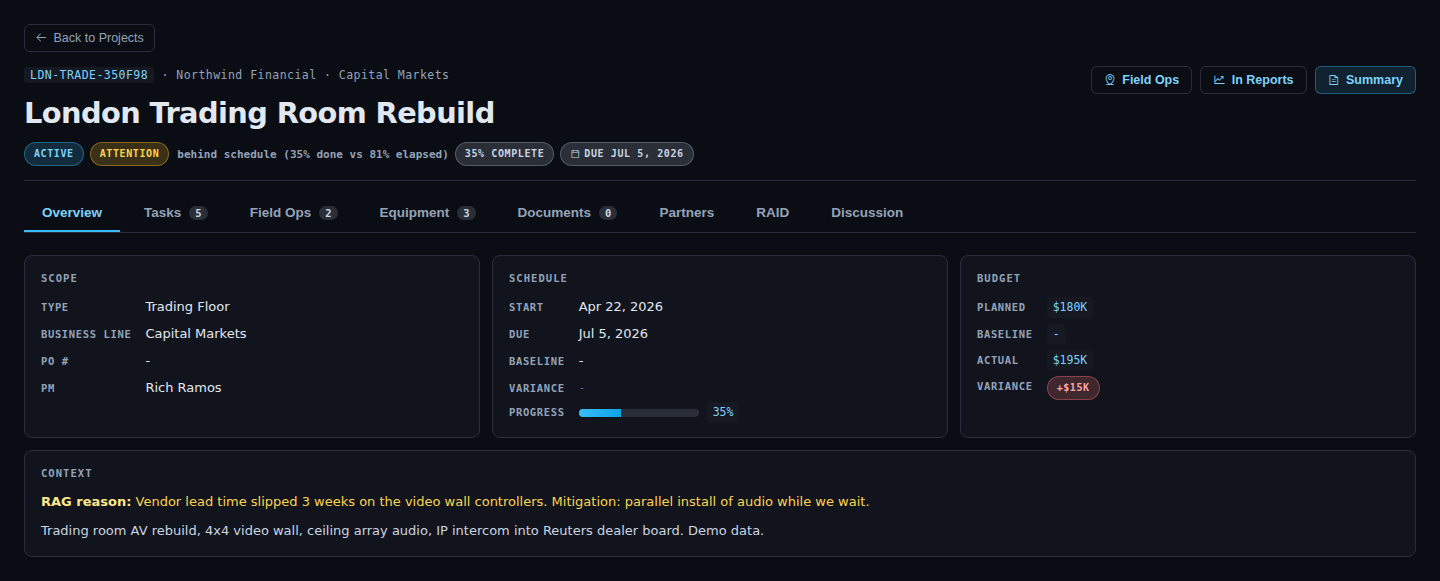
Click Projects again, or Dashboard, to head back. You have now opened a project from the list.
Step 4: Check device health
- From the dashboard or the left nav, click Infrastructure.
- You see your monitored equipment and its health. Room readiness lives next door under Rooms.
A device showing a healthy status needs nothing from you. A device flagged for attention is one to look into, and this is where you will start that. For your first run, the goal is simply to know that this screen exists and reflects the device-health summary you saw on the dashboard.
Step 5: See your field tickets
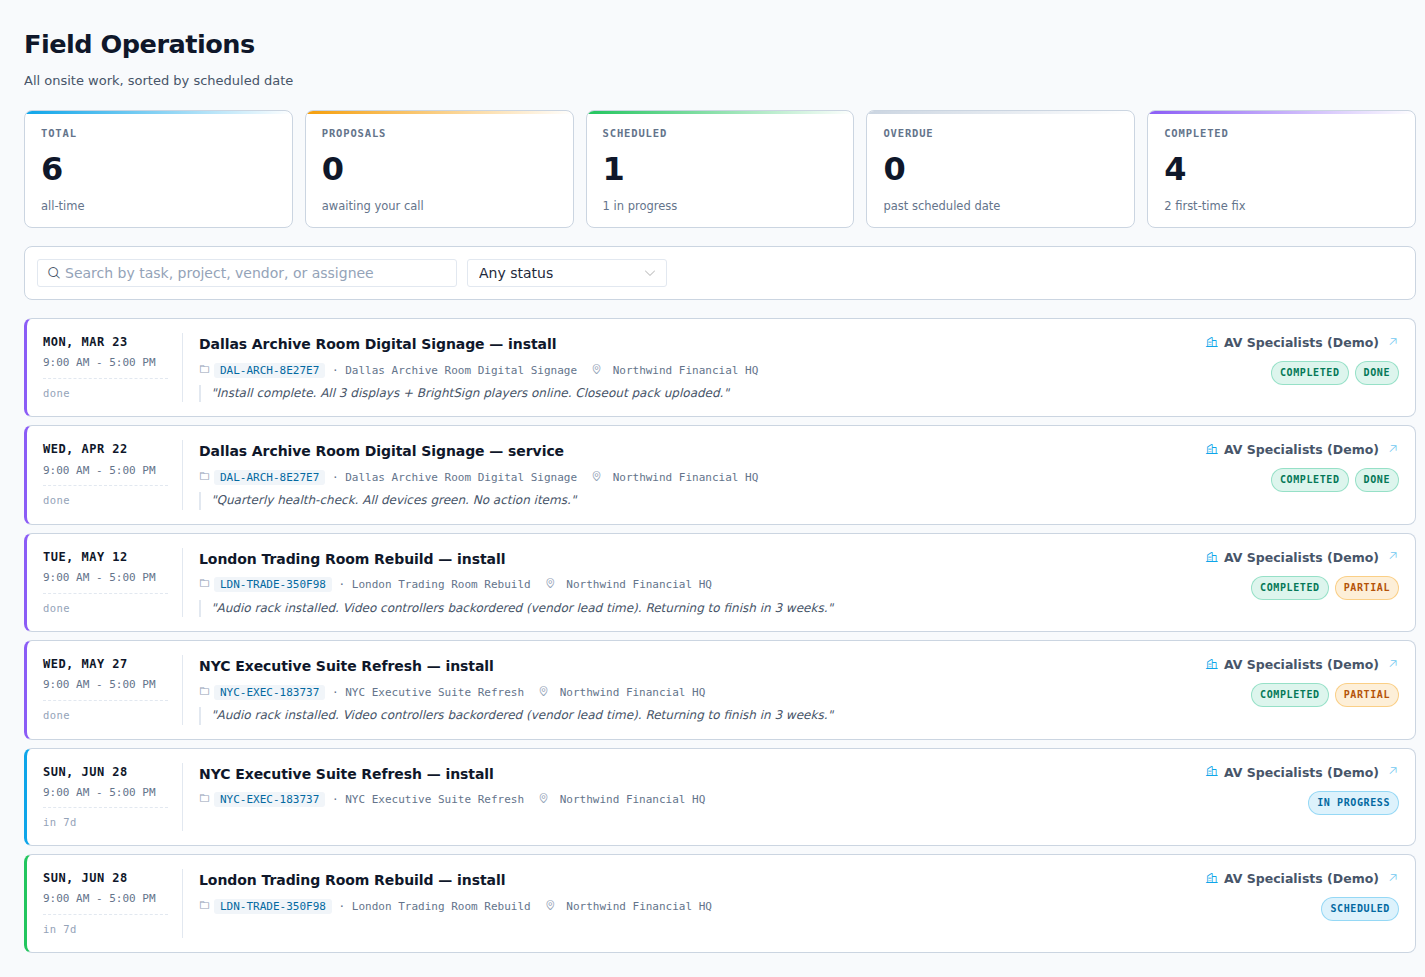
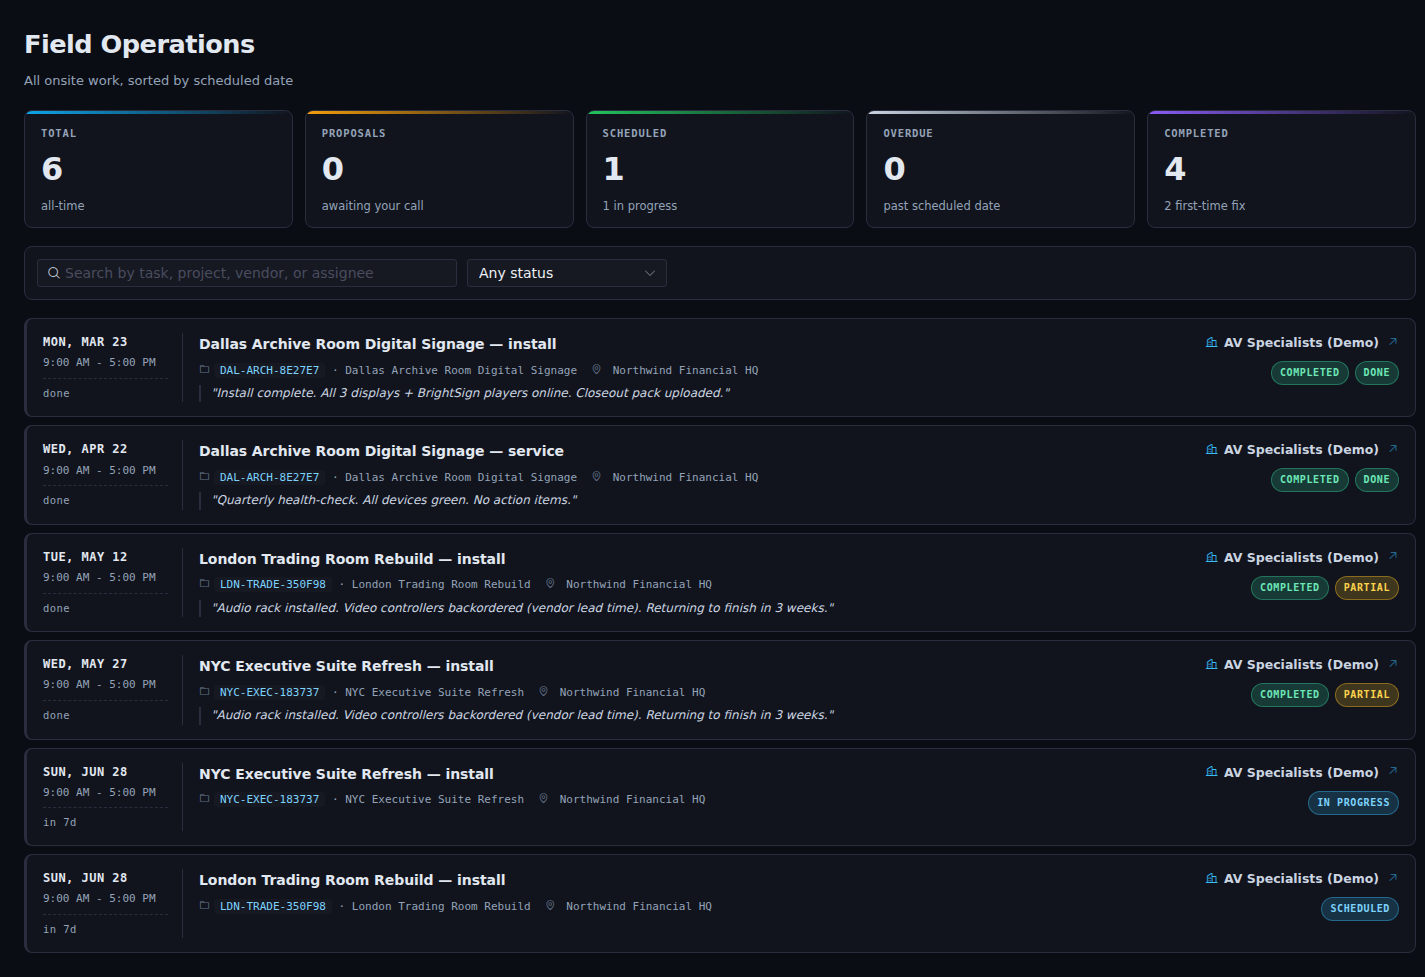
- In the left nav, click Field Ops.
- You see the on-site work and the visits your team is handling.
This matches the field-tickets summary on the dashboard, opened up so you can read each ticket. When a technician is dispatched or an on-site issue is logged, it shows here.
What you learned
You can now sign in, read your dashboard, and reach the three areas that tell you how your operation is doing:
- Open any project from the Projects list.
- Check equipment under Infrastructure, and room readiness under Rooms.
- Read on-site work under Field Ops.
That is enough to find your footing every day. When you are ready to go further, two areas are worth a look next: a project's Partners tab, where you invite an outside AV integrator into a single project, and Reports, where you see budget and status rolled up across everything you run.